

I woke up to the sound of heavy rain this morning and it’s raining quite hard now as I write this. But by some stroke of luck it was only a drizzle earlier when we did our regular Tuesday stream sampling.
Mud Bay was its usual constant self, perhaps a bit more lively than usual with the added water. A pair of greyish-brown fish, about 6” long, swimming in tandem, watched the placement of our sensor with professional interest. Later, at Wilfred Creek we got a distinct autumnal feel scaling our way down the bank. The light rain filtered its way through the canopy. Nestled in a natural bowl, Wilfred is always an oasis of coolness but today it was cooler and darker and the water less inviting than in the heat of summer. At Cowie Creek, a portion of the path leading to our site was completely flooded, trail merging with tributary. We had to bushwhack around the edge a bit to get to the familiar chocolate coloured water of post-rain Cowie.
Our sample results also reflected the changes brought by the recent rain. The Specific Conductivity of all three streams has dropped. Stream water that’s been working it’s way through dirt and rock tends to pick up various minerals which increases its conductivity. Rain water has no mineral content and therefore has low conductivity. So the dilution by rain water lowers the Specific Conductivity. In similar fashion, the recent rain, working its way through the top layers of soil, has washed a lot of the dry summer dust and debris into the water. As a result turbidity (a measure of cloudiness) has noticeably increased.
And the wells that we’ve begun monitoring seem to have responded to the rain as clearly as the creeks have. The descending line of Graph A tracks the level of a well that is measured manually once a week. The spikes are days with rain. The steady decline of the water level since late May slows and even reverses with rainfall. It appears to have begun the journey back up to winter levels.

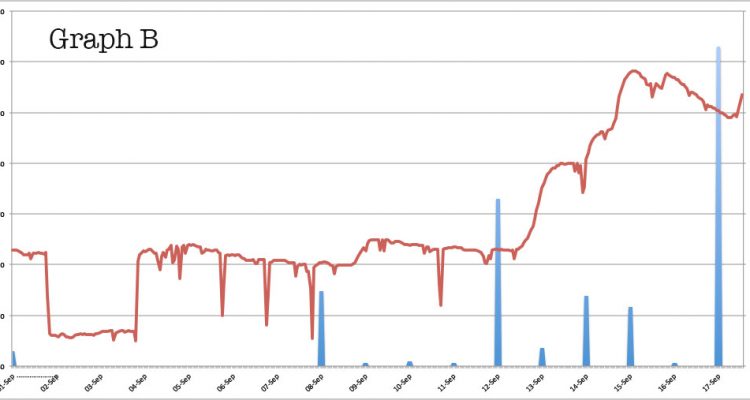
Graph B, from a different well, shows hourly changes during the first few weeks of September. The pulses of rain coincide with the beginnings of upward trends.
Similarly, Graph C, from a third well, shows a good, albeit raggedy, trend that bends upwards with increasing rain events. The jaggedness of this data is a puzzle. The well is lightly used and it’s hard to imagine a use pattern that would account for it. More than likely it’s a problem with one of our low-budget ultrasonic sensors.

What this all means in terms of hydrogeology is not yet clear to us. But as we continue to gather information, expanding our data set further into the future, the picture will start to come into focus. For now, we just keep our heads down, plodding forward, and trying to stay dry.